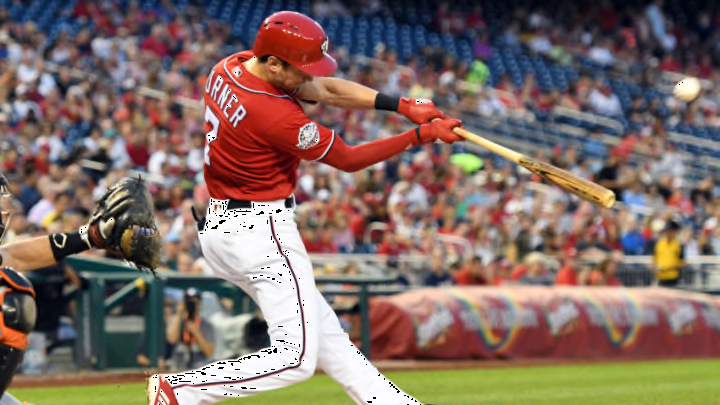
Washington Nationals shortstop Trea Turner lost his rookie season power stroke. What happened after he showcased it in 2016?
When Washington Nationals fans think of Trea Turner, it’s not his bat that first comes to mind. However, his skills with the lumber are how he made his first impression.
In 2016, despite playing in only 73 games, Turner secured second place in the National League Rookie of the Year voting. His slash line of .342/.370/.567 mirrored that of teammate and N.L. MVP runner-up Daniel Murphy (.347/.390/.595).
On the team leaderboard, his 3.4 WAR sandwiched him between two other all-stars, Stephen Strasburg and Wilson Ramos. However, since 2016, Turner has not been the same. His slash line in the previous two years combined is .276/.342/.429.
More from District on Deck
- Robots in Baseball? The Possibility of an Automated Ball/Strike System in the MLB
- Washington Nationals Re-Sign RHP Erasmo Ramirez
- Washington Nationals Sign RHP Trevor Williams
- Washington Nationals find Success in First Draft Lottery
- Washington Nationals: What to Know for the MLB Draft Lottery
This raises the questions of what happened to Turner and if his 2016 season was a mirage.
First, it’s important to identify what made Turner’s rookie season so different. It’s fairly obvious, his power was off the charts. Turner posted a .567 slugging percentage and .225 ISO. If he qualified for the league leaderboards, that slugging percentage would rank him fifth in all of baseball.
Digging a bit deeper into the batted ball stats, two stand out in particular. Turner’s HR/FB ratio of 16.7% and his FB% of 31.7%.
Turner’s HR/FB% in 2017 and 2018 combined is 10.6%, and his FB% is 33.3%. Essentially, Turner as a rookie hit fewer fly balls, but the ones he did hit left the ballpark at a higher clip.
When looking at Turner’s plate skills, they are remarkably consistent from year-to-year. His K% hovers right around 18% and his BB% increases 2.5% each year.
Incredibly, Turner’s O-Swing% is seven points higher in 2016 than in 2017 and 2018. However, his Z-Swing%, Z-Contact%, and Contact% marks are all similar year-to-year.
Looking at Turner’s hard contact rates, his 2016 mark of 34.8% was merely average. The same went for his medium contact rate of 48.0%.
Overall, Turner’s BABIP is above average. It was ridiculously high in 2016 at .388, with an average MLB player’s BABIP around .305. Over the past two years, it is .320.
It’s obvious Turner’s 2016 BABIP is not sustainable. However, because Turner earns back so many hits by beating out ground balls on the infield, it’s likely his BABIP won’t drop below average too often.
So, what can we conclude from all of these stats? It seems likely that Turner’s 2016 power outburst was likely a one-time thing. His plate skills did not change, yet his power dropped dramatically. It’s fair to chalk that up to the variance of baseball slowly evening out as more data points were plotted.
Turner will never light the world on fire with his bat. However, as long as his speed remains elite, Nationals fans should have no issues seeing his name at the top of the lineup card.
