Washington Nationals Ultimate Simulation: The Quarterfinals

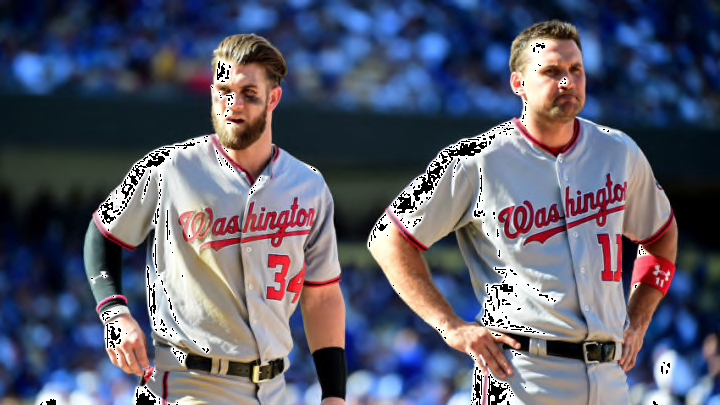
LOS ANGELES, CA - OCTOBER 10: Bryce Harper #34 and Ryan Zimmerman #11 of the Washington Nationals look on while taking on the Los Angeles Dodgers in game three of the National League Division Series at Dodger Stadium on October 10, 2016 in Los Angeles, California. (Photo by Harry How/Getty Images)
1 of 5
Next
(Photo by Harry How/Getty Images)
(Photo by Harry How/Getty Images) /

Eight Washington Nationals teams begin their quests to be named the best Nationals team of all-time. Which four will advance?

We have arrived! In this slideshow, the best Washington Nationals teams go head-to-head to compete for a spot in the final four.

If this is the first article you are reading in this series, be sure to check out our first post introducing the concept, and our slideshows introducing the eight teams in our field. There are four teams from the “Old School” Nationals and four teams from the “New School” Nationals.

Related Story. Introduction to the Ultimate Nationals Simulation. light

Now, let’s cover some basic ground rules for how these games will work.

The eight teams are seeded one through eight based on the number of wins they earned in their respective real-life seasons. For this series, there won’t be a regular season simulation, just the playoffs. It’s like getting to eat dessert without having to eat dinner!

The tournament itself looks just like it does in the NBA. Seeds 1, 8, 4, and 5 are in the top half of the bracket while seeds 2, 7, 3, and 6 are in the bottom half. All series are a best of seven. Home field advantage will rotate as it does in the MLB (2/3/2).

Speaking of home field advantage, there are some things to note.

First, yes, home field advantage matters. If the 2012 and 2016 Nationals meet in the finals, home field will matter despite all of the games being played in “Nationals Park.” The simulation program automatically gives the designated home team a small bump in production to account for the advantage.

Lastly, there is no losers bracket. Once a team is eliminated, they are gone for good. Alright, let’s get started, shall we?
washington nationals
washington nationals /

2012 Washington Nationals vs. 2006 Washington Nationals

Let’s get the boring series out of the way first. To no one’s surprise, the 2012 Nats simply demolished the 2006 Nats, sweeping them into the garbage with an average margin of victory of 6.5 runs.

The 2006 Nats scored a total of three runs in four games. The only player worth mentioning is Austin Kearns (’06). He led his team in the series with four hits for a .250 BA with one home run.

Outside of Kearns, the 2006 Nats didn’t stand a chance against the opposition’s pitching.

Edwin Jackson (’12) threw a complete game shutout with 11 K’s, Jordan Zimmermann (’12) threw eight shutout innings, and Gio Gonzalez (’12) threw seven innings of one-run ball with 12 K’s.

Of the 2012 Nats hitters, a few stood out. Danny Espinosa slugged .714, and Ian Desmond slugged .647, each with a home run. Desmond also tied Michael Morse for the team lead in RBI with five.

The MVP award for this series goes to Jackson for his marvelous performance in game four, abruptly shutting the door on any comeback hopes the 2006 squad may have dreamed of.

The 2012 Nationals roll into the semi-finals to take on the winner of the 2016 Nats and 2005 Nats.

washington nationals
washington nationals /

2016 Washington Nationals vs. 2005 Washington Nationals

Thankfully, there are no more sweeps in the quarterfinals. The rest of the teams in the quarterfinals at least acted like they deserve to be in the tournament.

Well, in the case of the 2005 Nats, it wasn’t much better. The 2016 Nats took care of business in five games with an average margin of victory of 4.6 runs. Much like the 2006 Nats, the 2005 Nats simply could not hit a baseball to save their lives as they scored six runs in five games.

Nick Johnson (’05) and Jose Guillen (’05) each recorded multiple hits, sending two over the fences. They also had Jamey Carroll (’05) who went 8 for 20, even if they were all singles.

Because of the fifth game, Max Scherzer (’16) exercised his dominance twice over the weak 2005 Nats hitters. Scherzer pitched 16.2 innings, surrendering only one run.

In game one, Mad Max threw 115 pitches and fell one batter shy of nine shutout innings, with just six strikeouts. For his efforts, Scherzer earns MVP of this quarterfinals series.

The 2016 Nationals will face the 2012 Nationals in the semi-finals. Two teams are in, and two spots remain.

washington nationals
washington nationals /

2014 Washington Nationals vs. 2011 Washington Nationals

After six hard-fought games, we have our first upset of the tournament. The 2011 Nationals defeated the 2014 Nationals by an average margin of victory of 3.5 runs.

In the games the 2011 Nats won, they won by an average of 5.75 runs per game. In their two losses, they lost by one run in a pair of 2-1 scores. This clearly shows that despite the underdog role the better team came out victorious.

The most valuable player award must be split in two for this series, but for a good reason. In games five and six, when the leverage was at its highest, these two players delivered.

In the third inning of game five, Roger Bernadina (’11) and Ryan Zimmerman (’11) hit back-to-back home runs off of Jordan Zimmermann (’14).

Then, in game six, it was groundhog day as they did the same again. This time in the sixth inning, these two went back-to-back off of Stephen Strasburg (’14) to turn a one-run deficit into a one-run lead.

Bernandina and Zimmerman raked in an upset for their team and will face the winner of the lucky seven’s quarterfinal matchup.

Washington Nationals Bryce Harper
Washington Nationals Bryce Harper /

2017 Washington Nationals vs. 2007 Washington Nationals

Sadly, our upset tally stops at one in the quarterfinals. In mostly high scoring affairs, the 2017 Nationals slugged their way to a five-game series victory over the 2007 Nationals, winning by only 2.2 runs per game.

More from District on Deck

The 2011 Nats hung with the power of the 2017 squad. Ryan Church (’07) and Dimitri Young (’07) each clubbed two home runs. Throw in Ryan Zimmerman (’07) and the trio combined to drive in 15 of the team’s 23 runs.

Typically, the story of the series would be an incredible pitching performance from ace Stephen Strasburg (’17). He pitched 14.1 innings, striking out 24, and keeping a 2.51 ERA. However, in this series, Bryce Harper (’17) was a man possessed.

We’ve seen a few players slug .700 in the quarterfinals. Harper puts those players to shame. Harper’s batting average in this series was .700 going 14 for 20. His slugging percentage? Double that at 1.400. He hit four home runs and drove in seven runs and was just a one-man wrecking crew, sending his team into the semi-finals.

With the 2017 Nats advancing, that leaves us with four teams. Two got to the semis with pitching, and two got there with hitting. The two that won with their arms face each other. The two that won with their bats face each other. The semi-finals going to be fun.

Next. Ultimate Nationals Simulation: The Semifinals. dark

Tomorrow, we move onto the semi-finals as things start to get serious in our simulation to find the ultimate Washington Nationals team.

Next