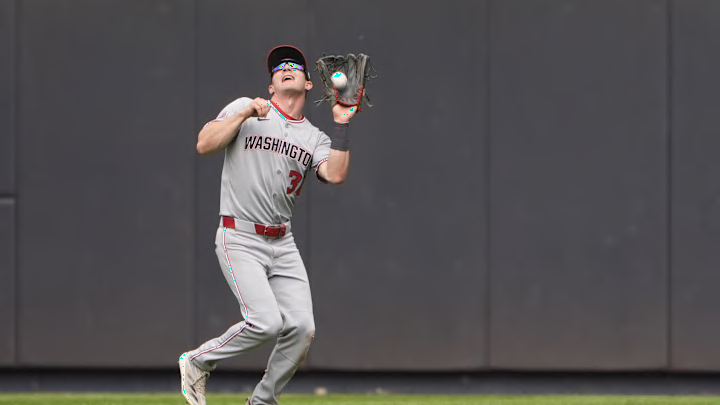
The Nationals have been very bad this year, there is no way around it. The team is currently 56-83 and looking towards the future. This team has been turned around more than most teams in the league. It seems that every few weeks, there is very much a new look to the team whether it is in the bullpen, bench, or fielding. This has led the team to be bad most notably in pitching, but they have been poor on some other obscure categories.
Defensive Rating
This is perhaps the least obscure of all, but bad nonetheless. The only team worse on defense in the MLB has been the Angels. The Nationals have rated -52.7 on defense this season. This means that defense alone, the team has allowed almost 53 more runs per game than the MLB average.
Total Home Runs Achieved
The best way to break out a multi-run inning is by hitting home runs. It is no surprise that the Dodgers and Yankees lead this category as they are consistently the best hitting teams in the MLB. As for the Nationals, they rank 3rd worst with just 126 home runs in 133 games. This is less than one per game. The MLB average is somewhere around 150 total home runs as of today.
FIP (Fielding Independent Pitching)
The team can blame their fielding all they want, but the pitching has been bad on its own. This statistic measures pitching ERA independent of fielding impact. This is pure pitch versus bat. Of course, the Nationals have had much turnaround in their roster, but that is no excuse for the fact that they are 3rd worst in FIP at 4.69 . Only the Angels and Rockies are worse.
Strikeouts per 9 Innings
As you can imagine, if a team cannot pitch well, they probably do not strike out a ton of batters. That is firmly the case in DC. The Nationals rank 4th worst in the MLB with 7.83 K/9. MLB average floats around 8.5 K/9. In fact, Mackenzie Gore is the only starter with a K rate above 20% (27.7%)
Left on Base Percentage
To further rag on the pitching, they are not clutch when they get into bad situations. The Nationals are 2nd worst in the MLB with a LOB% of 67.7%. Only the Colorado Rockies are worse in this statistic.
It is clear that the Nationals have some work to do. They must improve their pitching, above all. It has been awesome to see Cade Cavalli perform well in his recent time up in the majors. Hopefully, this team will build off of Cavalli and Gore, who just went on the IL, going forward.
