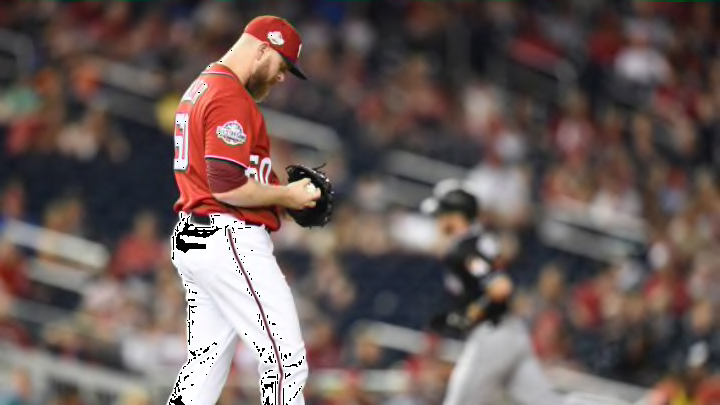
Washington Nationals pitcher Justin Miller looked like an angel from heaven. But how did Miller’s season fall from such grace?
Washington Nationals reliever Justin Miller just wanted a job. Coming off of a 5.48 ERA season in 2017 at Triple-A with the Salt Lake Bees, and a 5.70 ERA the year prior with the Colorado Rockies, it seemed like the end of the road.
In 2018, at 31 years old, the Nationals gave him a shot. And, despite all the odds, he had a near perfect start to his season.
In his first eight games, he pitched 10.2 innings while allowing two hits and struck out 21 batters. His FIP was -0.78. Mike Petriello of MLB.com said it best: “And we act like any of us know anything about baseball.”
More from District on Deck
- Latest DraftKings Sportsbook Promo Code in Maryland: Bet $5, Win $200 Guaranteed
- Nationals Claim Jeter Downs Off Waivers
- Washington Nationals Minor League Spotlight: Robert Hassell III
- Washington Nationals Tuesday Q&A
- 3 Free Agents the Nationals Should Gamble On
The Nationals needed a consistent bullpen option after experiments with A.J. Cole, Enny Romero, Trevor Gott, and Carlos Torres ended in DFA’s and demotions. It seemed like Miller was ready to fill the void before Brandon Kintzler, Ryan Madson, and Sean Doolittle took over in the late innings.
However, after June 13, Miller came crashing down to Earth posting worse numbers than his seasons in Triple-A and with Colorado.
Here’s the comparison between before and after that date:
May 26 – June 13
10.2 IP, 0.00 ERA, -0.78 FIP, 0.19 WHIP, 21.0 K-BB%
June 15 – September 11
37.2 IP, 5.02 ERA, 6.29 FIP, 1.41 WHIP, 10.4 K-BB%
This raises the obvious question. What happened to Justin Miller?
The first thing that jumps out is Miller’s elevated walk rate. Obviously, anything higher than 0% is “elevated,” but Miller’s 9.8 BB% after 6/13 is significant.
Digging a bit deeper, we can see Miller maintained his pitches thrown percentages (fastball 64.7%, slider 26.9%) throughout the season despite clear evidence his fastball was far superior.
Opponents batting average against his fastball is .211 compared to his slider’s .251 BA. Miller’s strikeout rate doubles with the fastball and he walks three percent fewer batters (6.7% vs. 9.7%) with his dominant pitch.
When we combine Miller’s inconsistent control issues with the fact hitters will adapt to hitting a 94 MPH fastball, we see hitters start to tee off on his slider.
Check out these two heat maps of Miller’s slider. This one is his slider from 5/26-6/13, when his slider had a positive pitch value according to Fangraphs.com. This map is his slider from 6/13 to 9/11, when his slider had a negative pitch value.
What the two maps show is fairly straight-forward. Miller kept his slider down early in the season and as the season progressed, it crept closer and closer to the middle of the strike zone.
For extra context, here is Chris Sale’s slider heat map. While there are many differences between Miller’s and Sale’s slider, you’ll notice that Sale keeps his slider exclusively below the belt. Miller doesn’t, and that’s when he runs into trouble.
The adage in baseball is that if you miss with a pitch, miss down and away. Makes sense, right? Alternatively, you’ll end up like Peter Moylan.
Miller’s comeback earlier in the season looked promising. However, when the smoke cleared, he looked like just another struggling Nationals reliever.
